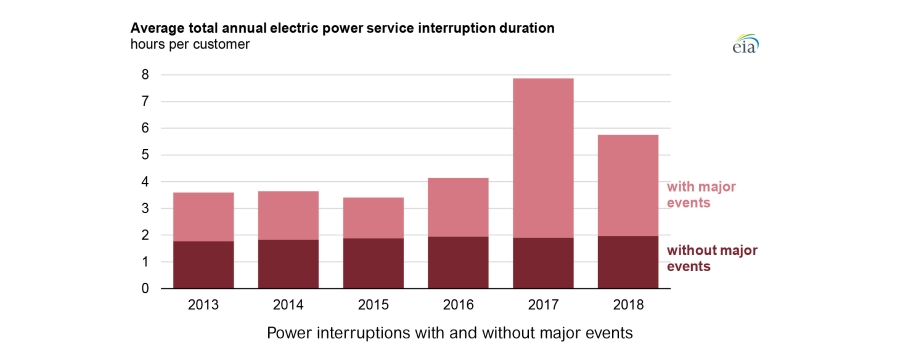
Another source also claims that big outages are increasing. The annual number of electrical grid failure events lasting at least one hour and impacting 50,000 or more utility customers increased by more than 60 percent over the last five-year reporting period. As interesting as that seems, it was not the major thrust of the study in which it was published …
So What Happens to People if a Major Outage Occurs During a Major Heat Wave?
The outage information above appeared in a study entitled Compound Climate and Infrastructure Events: How Electrical Grid Failure Alters Heat Wave Risk, which was published in the scientific journal Environmental Science and Technology on April 30, 2021. It noted that 46% of these blackout events occur between May and September. In the Northern Hemisphere, that’s when heat risks are greatest.
More importantly, the study evaluated and compared the effects of a hypothetical, concurrent, five-day heat wave and power outage event on the US cities of Atlanta, Georgia; Detroit, Michigan; and Phoenix, Arizona. For each locale, this study:
• reviewed the occurrence and magnitude of outages
• evaluated the occurrence and magnitude of heatwaves
• estimated the impacts of city-wide blackouts during these heatwaves on indoor air temperatures by using models for:
- regional climate
- building energy, including indoor air temperatures
- prevalence of air-conditioning systems
The results were sobering. The simulations predicted that concurrent heat wave and grid failure events of recent intensity and duration would produce indoor temperatures that expose between 68 and 100 percent of these urban populations to an elevated risk of heat exhaustion and/or heat stroke. Other interesting points:
• Temperatures inside single-family homes reach 4°C higher than temperatures inside apartment buildings.
• Lack of air conditioning disproportionately affects lower income households.
• Public cooling centers in these cities can accommodate only 1 to 2 percent of their residents. None of the cities required backup power for their cooling centers.
• Heat/outage risks like those for cities under study are a growing issue for the US as a whole.
You can read an abstract of the study here. A New York Times article summarizes the study here. The New York Times followed up and learned that only a collective subset of the cooling facilities in these cities have backup generators. (Interestingly, Detroit officials said they could deploy portable generators to shelters that needed them. For more information about this type of solution, review NEC Requirement for Permanent Manual Switching Means.) But none of this addresses the heat risks for the many residents that lack cooling or backup power.
The Takeaway
If the trends identified by these sources continue, the juxtaposition of climate developments with outage trends could raise the risk of "negative health outcomes" for people in affected areas. These risks could warrant measures that exceed existing code requirements for providing backup power. The issue would challenge not only public policy, but also the facility designers, power professionals, and facility managers that must consider risks posed by extreme events and conditions.
The timing and nature of any collective response could take multiple forms. At the simplest level, the issue is one more reason why critical backup power never seemed so critical.
End Notes
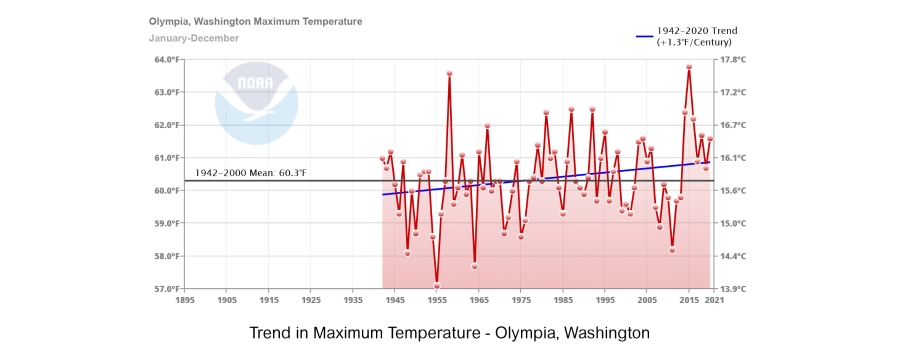
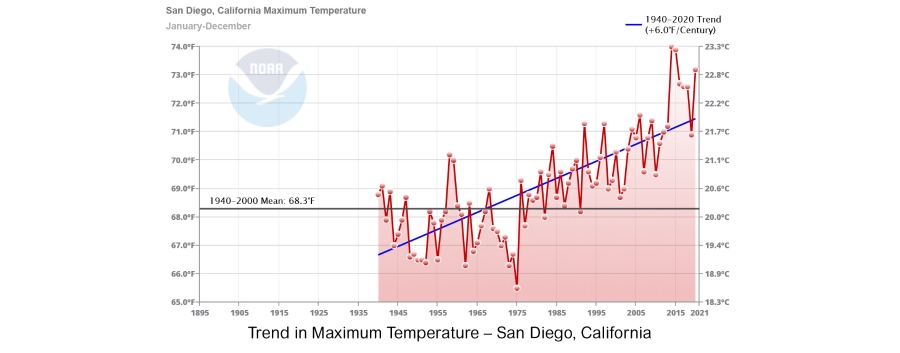
1. National Oceanic and Atmospheric Administration, U.S. Department of Commerce. The new U.S. Climate Normals are here. What do they tell us about climate change? May 4, 2021. https://www.noaa.gov/news/new-us-climate-normals-are-here-what-do-they-tell-us-about-climate-change. Accessed May 29, 2021.
2. National Centers for Environmental Information, National Oceanic and Atmospheric Administration, U.S. Department of Commerce. Climate at a Glance - National Time Series. May 2021. https://www.ncdc.noaa.gov/cag/national/time-series/110/tavg/ann/12/1895-2021?base_prd=true&begbaseyear=1901&endbaseyear=2000&trend=true&trend_base=100&begtrendyear=1895&endtrendyear=2021. Accessed May 29, 2021.
3. Ibid. Climate at a Glance: City Time Series. May 2021. https://www.ncdc.noaa.gov/cag/
4. Ibid. https://www.ncdc.noaa.gov/cag/city/time-series/USW00023188/tavg/12/12/1895-2021?base_prd=true&begbaseyear=1901&endbaseyear=2000&trend=true&trend_base=100&begtrendyear=1895&endtrendyear=2021&_sm_au_=iVVq0RkT7NDsr4THJ6F3jKH7c2fV2. Accessed May 29, 2021.
5. U.S. Energy Information Administration. U.S. customers experienced an average of nearly six hours of power interruptions in 2018. Jun 1, 2020. https://www.eia.gov/todayinenergy/detail.php?id=43915#. May 29, 2021.
6. B. Stone, E. van Mallen, M. Rajput, et al. Compound Climate and Infrastructure Events: How Electrical Grid Failure Alters Heat Wave Risk. Environmental Science & Technology, 55, 10, 6957-6964. April 30, 2021.
7. ACS Publications. How Electrical Grid Failure Alters Heat Wave Risk. April 30, 2021. https://pubs.acs.org/doi/10.1021/acs.est.1c00024. Accessed May 29, 2021.
8. New York Times. A New, Deadly Risk for Cities in Summer: Power Failures During Heat Waves. May 3, 2021. https://www.nytimes.com/2021/05/03/climate/heat-climate-health-risks.html. Accessed May 29, 2021.